
System Status
Click System Status in the top-right corner to quickly check the health of your server.
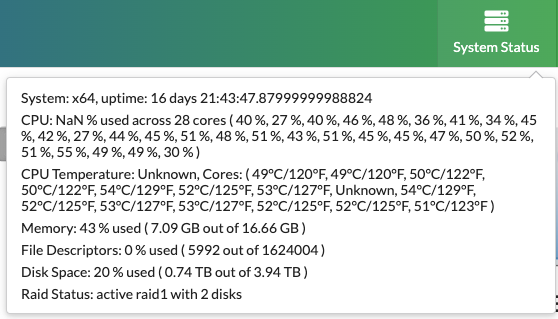
Uptime
Displays how long the server has been running since its last restart. To keep your system running smoothly, support recommends restarting it once per quarter.
CPU Usage
Typical CPU usage at rest ranges between 5%–30%. During heavier processing, usage may rise up to 60% without concern. Consistent usage above that level could impact playback performance.
CPU Temperature
Measured in Celsius. Some units may run up to 60°C under normal conditions. Temperatures over 60°C are acceptable, but anything above 70–80°C may indicate a problem and should be monitored.
Memory Usage
While not always a red flag, consistently high memory usage—especially in the 80%+ range—could signal a potential issue. Support can review the system for memory-related errors if needed.
Disk Space
Indicates how much storage remains for media content. For best performance, keep disk usage at or below 75%.
RAID Status
If your system includes RAID (more common in QuickRoll units than QuickCast or Mini), this section will show its current state. A degraded RAID requires support intervention to assess drives and restore redundancy.
Contact Support
If you notice anything concerning in the System Info panel and have a C4 or C8 support contract, please contact support as soon as possible so we can evaluate your system’s health and advise on next steps.